Question: Whats the difference between tracing, logs, and metrics?
Tracing, Logs, and Metrics are three core components of observability, each serving distinct but complementary roles in understanding system behavior.
🔹 Logs
- What they are: Chronological records of discrete events that occur during program execution (e.g., “User logged in”, “Database query failed”) 7.
- Purpose: Primarily used for error tracking, debugging, and auditing. Logs help answer “What happened?” and “When did it happen?” 9.
- Format: Usually unstructured or semi-structured text, often timestamped and tagged with severity levels (e.g., INFO, WARN, ERROR) 7.
🔹 Tracing
- What it is: A technique to track the flow of a single request as it traverses multiple services or components (e.g., from API gateway → auth service → database) 13.
- Purpose: Provides end-to-end visibility into request paths, latency, and failure points—especially critical in distributed systems [[1], [11]].
- Structure: Composed of spans (units of work) nested in traces; visualized as flame graphs or Gantt charts [[11], [13]].
- Use case: Diagnosing slow responses or failures across service boundaries [[1], [5]].
🔹 Metrics
- What they are: Quantitative, time-series measurements (e.g., request rate, CPU usage, error counts) 6, 9.
- Purpose: Ideal for trend analysis, alerting, and capacity planning. Metrics answer “How is the system performing?” 6.
- Format: Structured and aggregatable (e.g., counters, gauges, histograms) 6.
🔸 When to Use Metrics, Logs, or Traces
Metrics, logs, and traces are complementary observability signals—not replacements for each other. Each answers different questions and excels in specific scenarios.
| Consider Metrics When… | Consider Logs When… | Consider Traces When… |
|---|---|---|
| You need to monitor system health over time | You need to investigate specific errors or events | You need to track a request across service boundaries |
| You want to set up alerting (e.g., “error rate > 1%“) | You need to debug a specific request using IDs | You need to find the exact span where latency occurs |
| You care about trends, aggregations, and patterns | You need raw context, stack traces, or user actions | You’re diagnosing slow responses in distributed systems |
| You need low storage/processing overhead | You’re doing post-mortem analysis or compliance auditing | You need to understand request flow and dependencies |
| You’re capacity planning or auto-scaling | You need to match errors across different services | You want to visualize dependencies and request paths |
🎯 Why Metrics Instead of Just Logs?
Logs capture every event but are too noisy and expensive for real-time monitoring:
-
Aggregation Efficiency: Metrics pre-compute values (sums, averages, percentiles), while querying logs for aggregated insights requires scanning massive datasets. For example, calculating error rates from logs across millions of events per second is computationally expensive; metrics do this inline.
-
Real-time Alerting: Metrics are time-series data designed for rapid aggregation. You can quickly detect anomalies using threshold-based alerts. With logs, you’d need to constantly parse and aggregate in real-time—introducing latency and cost.
-
Storage Cost: Storing every log line is expensive (GBs/TBs/day). Metrics are orders of magnitude smaller because they store only numerical summaries.
-
Dashboard Visualization: Trending data over time (e.g., “requests/second over 24 hours”) works naturally with metrics. Extracting this from logs requires complex aggregation queries.
Example: Monitoring a web service. Metrics tell you the error rate spiked to 5% across all endpoints. Logs alone wouldn’t reveal this pattern—you’d need to manually scan countless entries to notice the trend.
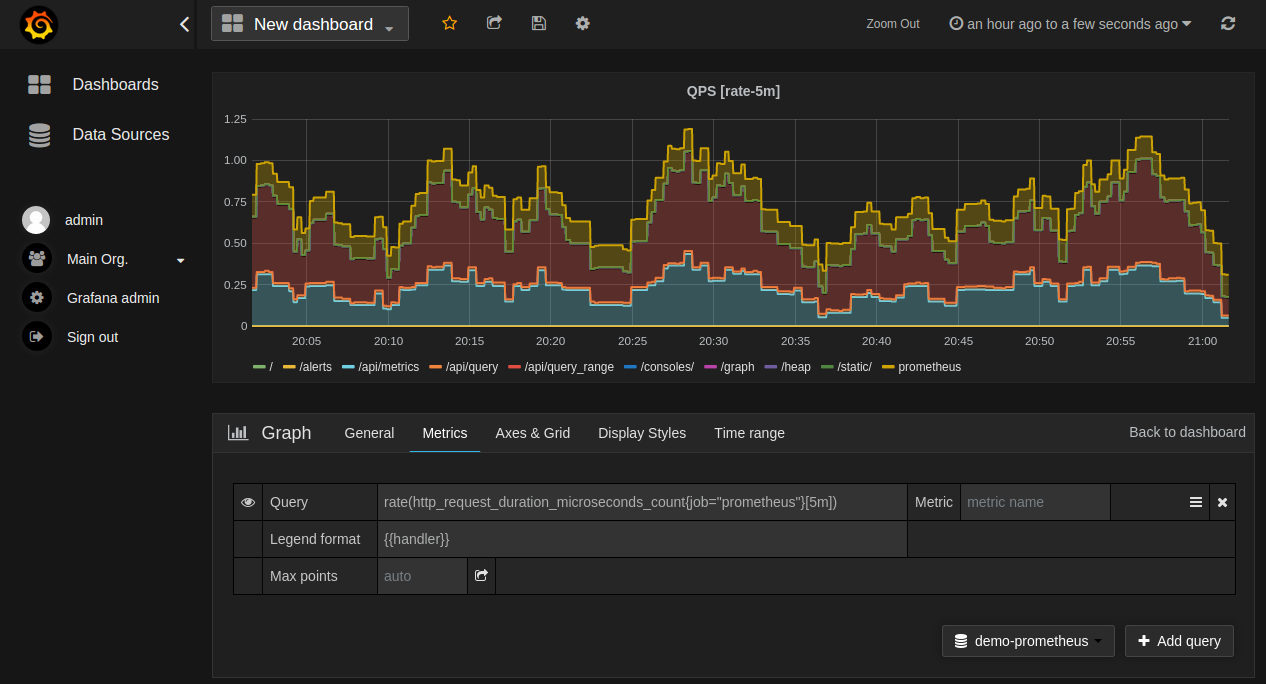 Prometheus time-series database
showing system metrics over time
Prometheus time-series database
showing system metrics over time
🎯 Why Traces Instead of Just Logs?
While logs record individual events, traces provide context and causality across distributed systems:
-
End-to-End Request Flow: A single user request may traverse 10+ services. Logs from each service are disconnected unless correlated by trace IDs. Traces natively capture this relationship with parent-child span relationships.
-
Latency Breakdown: Logs can tell you each service took 100ms, but traces show exactly where time was spent (e.g., 50ms in auth, 80ms in database). This is critical for identifying bottlenecks.
-
Failure Context: If a request fails, traces show the entire path—what succeeded, what failed, and where. Logs from individual services lack this cross-service context.
-
Dependency Visualization: Traces reveal service boundaries and call sequences, helping you understand system architecture and potential single points of failure.
Example: A user reports a slow page load. Logs from the API gateway show a 2-second response. Logs from the auth service show 200ms. Logs from the database show 100ms. Without traces, you can’t correlate these or see that the auth service was actually waiting on the database (1.5s of wait time hidden in individual logs).
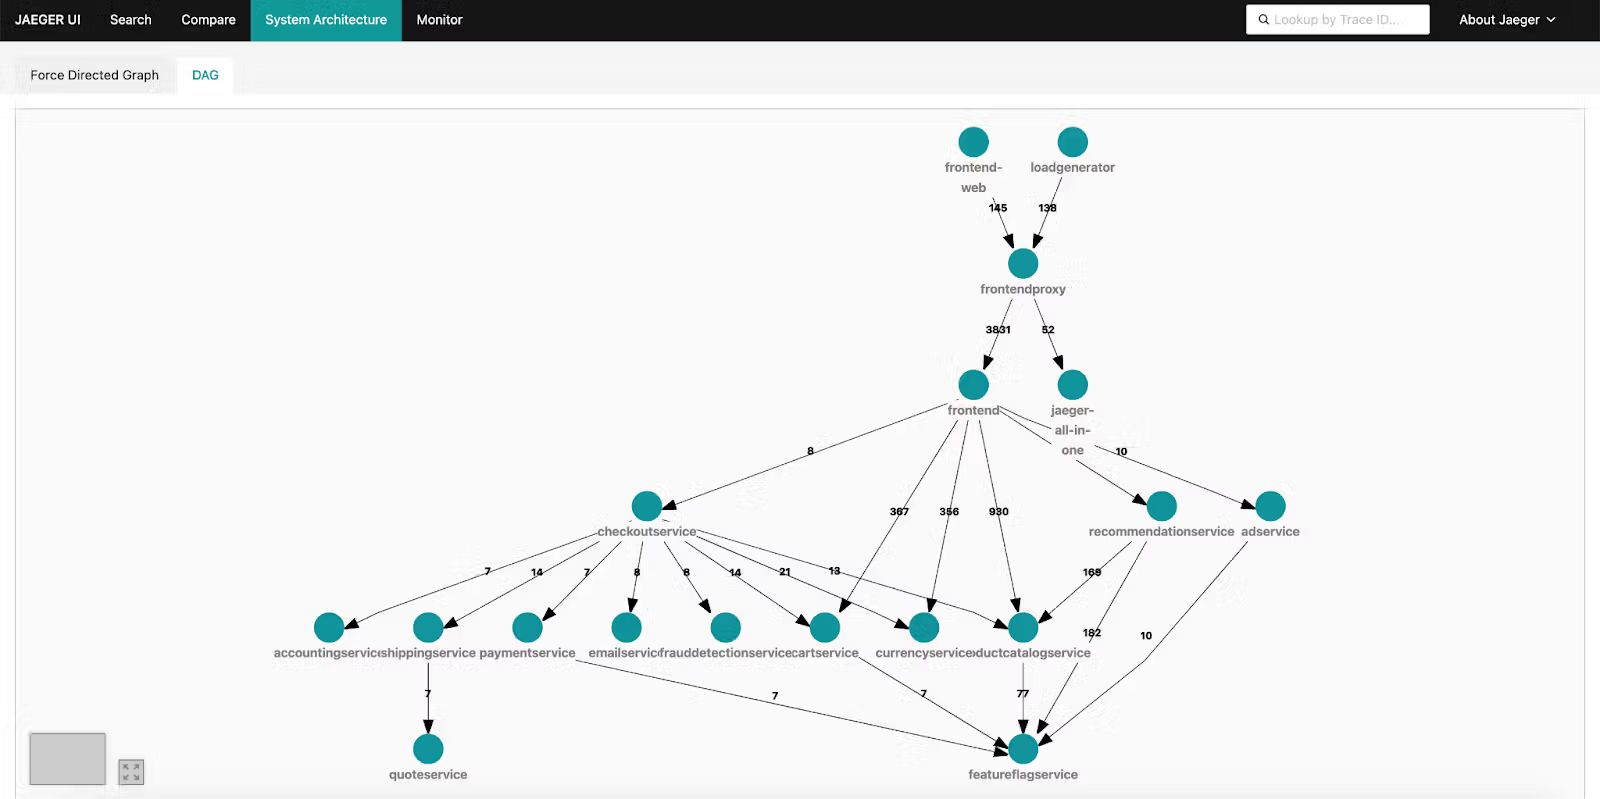 Jaeger trace visualization showing a
distributed request across multiple services with latency breakdown
Jaeger trace visualization showing a
distributed request across multiple services with latency breakdown
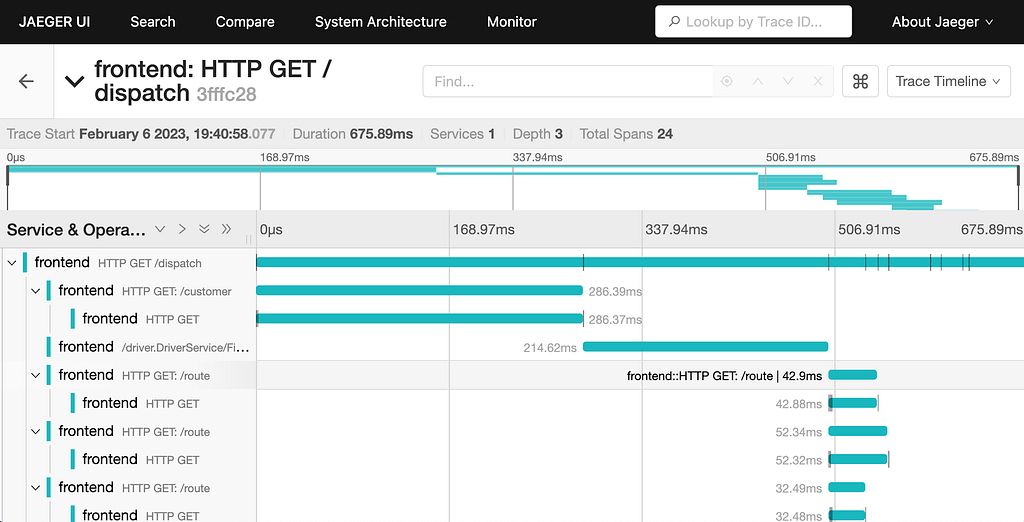 Flame graph view in Jaeger
highlighting which spans consume the most time
Flame graph view in Jaeger
highlighting which spans consume the most time
🎯 Why Logs Instead of Just Metrics or Traces?
Logs provide context and detail that metrics and traces cannot:
-
Rich Context: Metrics are numbers; traces show flow. Logs contain the actual messages: error stack traces, variable values, user IDs, request payloads. This is essential for debugging.
-
Unpredictable Events: You can’t pre-aggregate unknown error conditions in metrics. Logs capture everything—including rare, unexpected errors that metrics might miss in the noise.
-
Debugging Speed: When tracing identifies a problematic span, logs provide the exact log lines from that span (with context like user ID, request parameters, error messages) to pinpoint the cause.
-
Compliance & Audit: Logs provide an immutable record of what happened, often required for regulatory compliance. Metrics summarize but don’t replay events.
Example: A trace shows a 500 error in the payment service. The metric shows 0.1% error rate (acceptable). But only logs contain the actual error: “Payment declined: insufficient funds” with the user’s transaction ID—needed to investigate and communicate with the user.
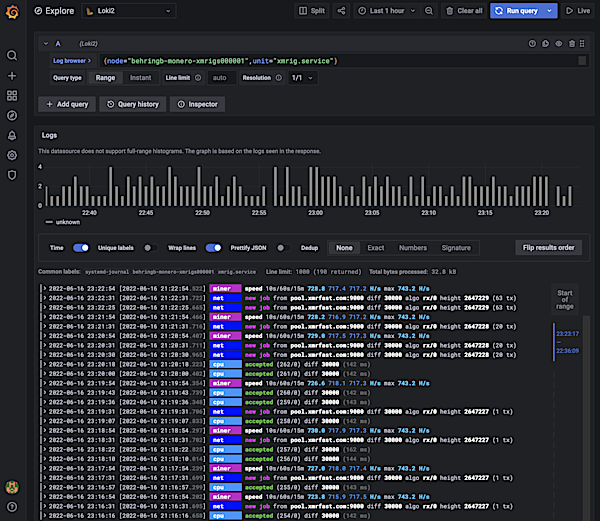 Grafana Loki aggregated logs with
label-based filtering and search
Grafana Loki aggregated logs with
label-based filtering and search
🔗 The Synergistic Workflow
The three signals work best together:
- Metrics detect: Threshold-based alerts tell you something is wrong
- Traces localize: Identify which request/path/service is affected
- Logs debug: Provide context to understand and fix the root cause
Example workflow:
- ✅ Metrics show error rate increased from 0.1% to 5% → Something is wrong
- ✅ Traces reveal the spike is from
/api/checkoutrequests in the payment service → Where is it wrong? - ✅ Logs with that trace ID show:
PaymentProviderError: Connection timeout to Stripe→ Why is it wrong?
🌐 Observability Concepts
Observability is the property of a system that allows engineers to understand its internal state from its external outputs [[4], [10], [12]]. It goes beyond monitoring by enabling root-cause analysis of unexpected behavior, not just detection 16.
The three pillars of observability are:
- Metrics – for high-level system health and trends
- Logs – for detailed event-level debugging
- Traces – for request-level flow and latency analysis
Together, they provide a comprehensive view:
- Metrics tell you something is wrong
- Traces tell you which request/path is affected
- Logs tell you what happened and why
This layered approach prevents log overload while maintaining debugging capability.
⚖️ Key Differences Summary
| Aspect | Logs | Traces | Metrics |
|---|---|---|---|
| Granularity | Event-level (e.g., function call, error) | Request-level (end-to-end path) | Aggregated (e.g., avg latency, error rate) |
| Structure | Semi-structured text | Hierarchical spans (parent/child) | Numerical, time-series |
| Primary Use | Debugging, auditing | Performance analysis, distributed debugging | Alerting, trend analysis |
| Cost/Overhead | Moderate | High (esp. in distributed systems) 5 | Low (aggregated) |
Sources
- java - What is the difference between Tracing and Logging? - Stack Overflow
- What is observability? Not just logs, metrics, and traces - Dynatrace
- Tracing Vs. Logging – Key Differences + Examples - Edge Delta
- What Is Observability? | IBM
- Logging vs Tracing in real projects — how deep do you actually go?
- Observability in 2025: How It Works, Challenges and Best Practices
- Tracing vs Logging vs Monitoring: What’s the Difference? – BMC Helix
- What Is Observability & How Does it Work?
- Logging vs Metrics vs Tracing: What’s the Difference? | Better Stack Community
- What Is Observability? Concepts, Use Cases & Technologies - Tigera.io
- Monitoring explained: What is the difference between Logging, Tracing & Profiling? - greeeg.com
- Observability That Works: Understand System Failures and Drive Better Business Outcomes | Splunk
- Traces - OpenTelemetry
- What Is Observability? Key Components and Best Practices
- Screening and Assessment of Contaminated Sediment
- What is Observability? A Guide to Success - Cribl